Timekeeper
The gateways ships with a high-performance and low-overhead timing framework allowing users to non-invasively observe the overall live performance of the system. One of the main design goals was that the overhead should be low enough so it can be used even in production settings. This latter point is important to monitor and improve performance, given the difficulty of creating realistic performance benchmarks.
Design
There are four main parts to the timing framework:
- low overhead hardware counter based timestamps using
rdtscp+quantato convert back to real time - shared memory
Queuesto offload timing messages to - a
Timerstruct which facilitates generating and offloading timing messages - Dressed data messages carrying information about what original event caused them:
InternalMessage
When a message arrives in the gateway from the outside world, e.g. any given RPC call, an origin timestamp is taken.
Any downstream message created in the various Actors as a result of this original message will automatically get dressed with this origin timestamp. This allows for the tracking of internal latency, i.e. "how long did it take for a given message to propagate through the system".
The main process offloads all the timing messages to a set of shared memory called Queues, one per Timer. The Timekeeper process can then be used to gather live statistics based on these messages and visualize them with a terminal user interface. The major benefit from this approach is that the Timekeeper can be started or stopped without the main gateway process being impacted.
Terminal Interface
The Timekeeper can be started using
cargo run --bin --release bop-timekeeper
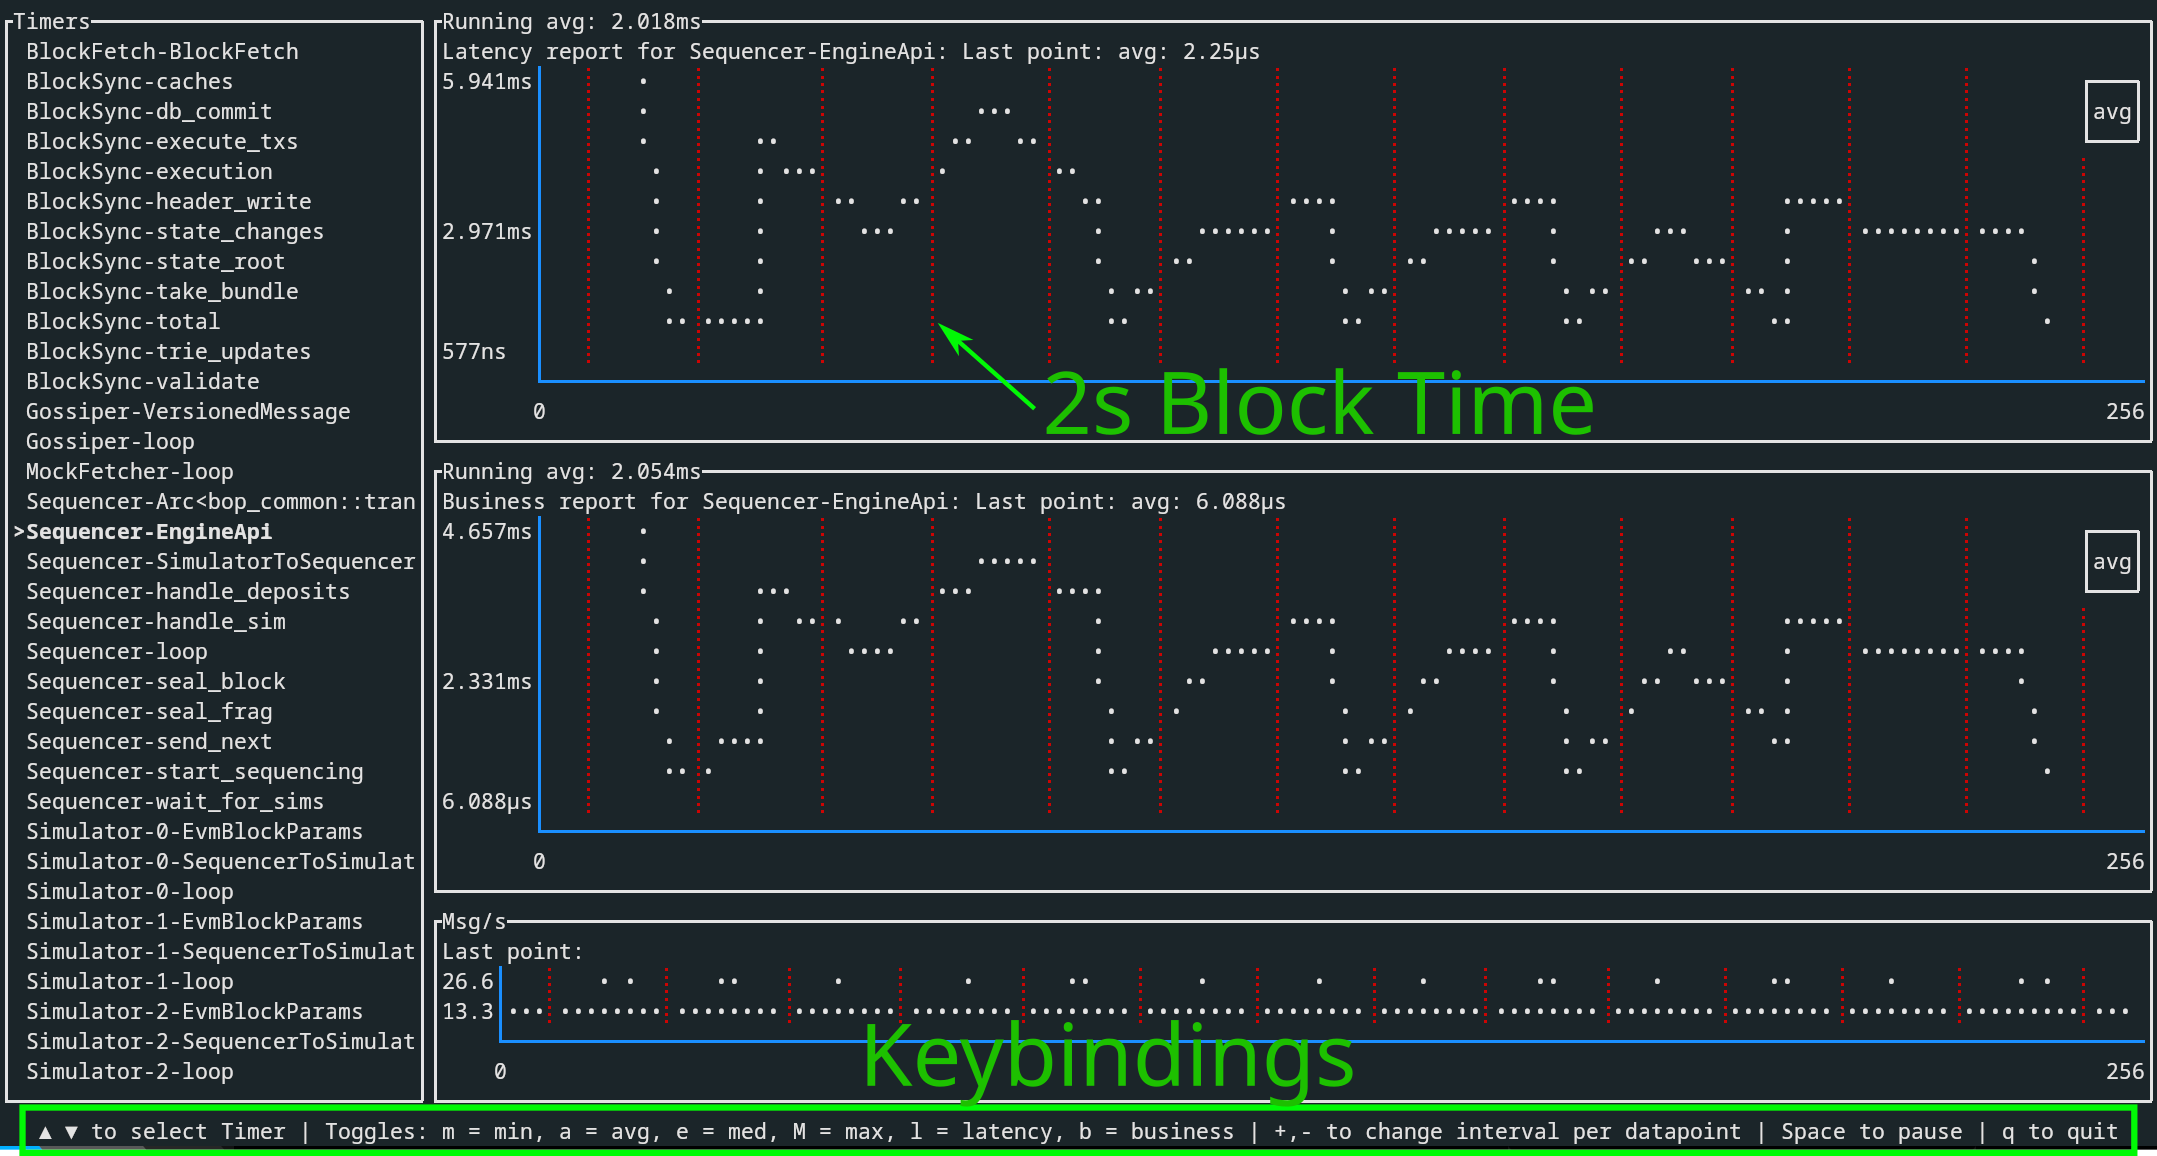
which starts the time gathering and shows a terminal interface:

By default only the averages avg are shown, but by pressing m, M, e one can toggle the minimum, maximum and median statistics plots, respectively.
Other keybindings can be found in the footer.